New York Subway Vs. D.C. Metro

Posted: July 23rd, 2008 | Author: | Filed under: Transit, Transportation, WMATA | 4 Comments »

A recent visitor to this website asked this question on a previous post:

hello, i am a New Yorker who relocated moved to DC last year. in my decades of riding the NYC subway, at $70/month unlimited rides, I have probably experienced a handful of delays and/or major issues with the tracks. in my one year of having lived in DC, there has been an average of one major delay per week due to track or other issues —- and I pay over $4.00 per one-way trip.

can you offer some thought or explanation as to why this is, in the context of the two train systems?

Although I know far more about the history and operations of Metrorail than the New York City Subway, here’s my general reaction on the reasons this rider has experienced more delays on Metro:

1. System redundancy: When I have traveled to New York, I often noticed construction work or service disruptions on the subway. However, unlike the Metro, the system has multiple tracks on most routes and many tunnels to route trains during disruptions. Metro, on the other hand, has much more limited flexibility – when a train breaks down, there’s no alternate track or tunnel for those behind it to travel on. Here’s some thoughts about why that is.
2. Funding differences: WMATA is generally under-funded and has no dedicated funding source – they go begging each year for tax dollars from Maryland, Virginia, and D.C. In the words of a fellow planner: “Over the years, WMATA has had to make a choice: make needed track repairs for mid-life preventative repairs or pay for additional rollingstock to meet massive demand. WMATA chose for years to purchase additional rollingstock.” I don’t know the history of New York Subway funding, but today the system is run by a huge state agency.
3. System age: The New York City subway is very old. This means that they have lots of maintenance to do, but it also means they have been at it for a while. The Metro is just hitting middle age, meaning lots of things are breaking for the first time now, at the same time they are facing the strain of record ridership.

What About the Price?
The issue of cost raises several issues, First, I should remind the commenter that the New York City subway, like New York City itself, is unique by American standards. The city has a unique history, namely it grew explosively before the auto age, setting a template for high density, transit-oriented development. As a result, the city’s density is off the charts, low auto ownership off the chart, transit use off the chart, and the activity level on its streets generally higher than anywhere else in America. I’m always surprised by former New Yorkers who somehow think their city is a reasonable standard to compare any other city in America. (You can’t get a good slice of pizza, everything closes early, your subway is worse, etc.) In fact, you should expect other American cities to be very different than New York.

That said, there are several reasons Metro’s fare is higher. First, they charge high fares because they need the money and they can. Second, their ridership peaks heavily, meaning most riders travel during peak times. The New York Subway’s riders are spread out more throughout the day, and the system is open 24 hours. Operating a system with high peaks is much more expensive than a system with more even ridership in terms of trains, personnel, and infrastructure. Third, given the Metro’s size and relationship to the region, for many riders it functions more like a commuter rail system. In fact, despite the graduated fares my analysis showed the longest distance riders are getting the best deal — under $0.50 a mile, lower than the IRS mileage rate.

These are just some quick thoughts regarding the differences, and I’d be interested in other perspectives.

In casual conversations, the convenience of the New York Subway is the gold standard for American public transit, and for good reason. Although it has flaws, it is enormous and a relative bargain for travelers. We also haven’t built anything like it for over 100 years. That’s why I’ve been spending my time writing about what we need to change to increase investment in alternatives to the road and freeway network.


Accomodating Ridership Growth at Metro Stations

Posted: May 30th, 2008 | Author: | Filed under: Transit, Transportation, WMATA | Comments Off

Metrorail’s relatively new Station Access & Capacity Study provided us the raw data to evaluate how well the Washington region jurisdictions were doing cultivating transit oriented development, but now that summer is here I had more time to go back and investigate it in more detail. The study sought to predict ridership growth and station improvements that may be needed. They concluded ridership will growth to 970,000 daily by 2030, or a 42 percent increase from 2005 to 2030.

The report concludes major changes will be needed to smooth transfers at busy stations and respond to growing peak demand. Here are some of the recommendations:

“Based on an order-of-magnitude analysis, the study identified a list of highest-priority capital improvements, including:

  • Farragut North-Farragut West Tunnel: Construct pedestrian tunnel between two stations.
  • Farragut North: Add southeast mezzanine-to-platform vertical capacity.
  • ?Metro Center: Add platform-to-platform vertical capacity, possibly by building the Farragut North-Farragut West pedestrian tunnel. Building this tunnel could reduce Orange or Blue Line transfers to the Red Line.
  • Gallery Place-Metro Center Tunnel: Construct pedestrian tunnel between two stations.
  • ?Gallery Pl-Chinatown: Add platform-to-platform vertical capacity and faregates at the north mezzanine and extend mezzanine between 7th and 9th Street entrances.
  • ?L’Enfant Plaza: Add platform-to-platform vertical capacity, possibly by building the Gallery Place-Metro Center pedestrian tunnel. Building this tunnel could decrease L’Enfant Plaza transfers.
  • ?Shady Grove: Add mezzanine-to-platform vertical capacity

Here’s the projected ridership by station in 2030:

2030 Project Average Daily Boardings

And a full summary of where improvements will be needed:

Projected Capacity Problems

The report is also full of data interesting to people like me. For example, did you know an escalator can handle 90 people per minute?

> Metrorail Station Access & Capacity Study (PDF)


Measuring Regional Transit Oriented Development

Posted: May 3rd, 2008 | Author: | Filed under: District of Columbia, Maryland, Transportation, WMATA | 4 Comments »

WMATA recently released the 2008 Metrorail Station Access & Capacity Study (PDF) which analyzes how the system can accommodate future growth in detail. David has a good summary of the report’s major recommendations for improvement and expansion. A table in the report caught my eye that showed the estimated number of jobs and households around a number of Metrorail stations from the year 2005. Metro’s Office of Long-Range Planning was kind enough to provide me the complete spreadsheet of the number of households and jobs within half a mile of each station, distilled from the Washington Council of Government’s transportation planning data. (I assume the numbers were calculated by summing the jobs for each traffic analysis zone whose center was half a mile from a Metro station.)

I’m using the data for a larger ridership study that should appear here sometime in the future, but in the meantime I realized it allows us to evaluate the level of transit oriented development in each jurisdiction. For Montgomery County and Prince George’s County, because the stations are spaced sufficiently far apart, we can also estimate the percentage of total jobs within half a mile of a Metro station. This relative measure takes into account the many more jobs in Montgomery County. Because the half mile radii overlap significantly in Arlington, Alexandria, and D.C. I can’t easily say what proportion of all jobs are accessible by transit for those jurisdictions.

Here’s the results after averaging the development for each station in the various jurisdictions.

TOD Chart

The analysis confirms what we might expect: D.C. and Arlington have the most jobs near their stations, and the Prince George’s County stations have the fewest in absolute terms. The pattern holds in relative terms for the Maryland counties — according to the WMCOG data, roughly 50% of Montgomery County’s 500,293 jobs were within 1/2 mile of a Metro station, versus only 38.4% of Prince George’s County’s 358,450 jobs. While I agree there’s much Prince George’s should be doing to boost development around their stations, there are a couple important caveats. The county has seen much less real estate investment than other parts of the region, and the Metro stations are much newer. Metro made it all they way out to Shady Grove in 1984 and Glenmont in 1998, versus Greenbelt in 1993, Branch Avenue in 2001, and Largo Town Center in 2004.

For households, on average Arlington County’s stations have slightly more than D.C. stations, likely a reflection of Arlington’s aggressive development of high density housing along the Rosslyn-Ballston corridor and the low-density residential neighborhoods surrounding many D.C. stations.

Not surprisingly, some of the least-used stations I identified in my popular post on station ridership also have the least development around them. My next step is to use a regression to evaluate the relative role of jobs, housing, parking, bus lines, multi-modal access, and a variety of other variables to explain ridership.


Metro’s Underperforming Stations

Posted: March 26th, 2008 | Author: | Filed under: District of Columbia, Transit, WMATA | 33 Comments »

The Washington, D.C. Metrorail system is a massive investment in regional infrastructure. It’s construction and maintenance requires billions dollars of tax money, but few would question it’s importance to the region. It has shaped growth and kept hundreds of thousands of cars off the road daily, improving the quality of our air and city.

Although the system is famously congested along busy lines at rush hour, many stations operate well below their capacity. Of the system’s 86 stations, 32 (or 37%) had fewer than 5,000 average weekday riders (boardings) in 2007. If the entire system is subsidized by taxes, these stations are the most deeply subsidized. Given the huge expense of the station construction, maintenance, and staff, is it acceptable to let these stations remain underutilized?

The 32 stations with fewer than 5,000 daily riders in 2007 are as follows: Morgan Boulevard, Cheverly, Deanwood, Arlington Cemetery, Eisenhower Ave., Capitol Heights, Forest Glen, Congress Heights, Landover, Waterfront, Benning Road, Naylor Road, Minnesota Ave., New York Avenue, Potomac Ave., Mt Vernon Sq-UDC, Shaw-Howard Univ, Van Dorn Street, West Hyattsville, Virginia Square-GMU, Addison Road, White Flint, Clarendon, Navy Yard, East Falls Church, Braddock Road, College Park, Rockville, Twinbrook, Georgia Avenue, Wheaton, Prince George’s Plaza, Cleveland Park.

Metro's Least-Used Stations

A comparison to the system’s busiest stations helps clarify the factors involved:

Metro's Busiest Stations

Clearly, the busiest stations are located in high density areas with transit oriented development, served by multiple lines, connected to other modes (like buses and trains). However density alone is not enough: both Prince George’s Plaza and Crystal City are adjacent malls, but one among the least-used and the other among the busiest.

In addition to the much-needed reforms of WMATA’s development program and always-needed reform of local government plans and processes to require good design and high density, there is much that could be done. A ridership SWAT team could analyze each station, and provide recommendations for how ridership could be increased in the short, medium, and long terms. Suggestions may range from better wayfinding, improved usability of feeder bus service, increased police patrols or lighting to address safety, reforms to encourage new TOD, better bus shelters, recruiting local employers to encourage transit use, bike racks, or a host of other changes. Perhaps as a incentive WMATA could begin charging the home jurisdictions fines if they are unable to improve ridership at their stations.

While much of the discrepancy may lie with the region’s unequal distribution of development or poor land-use planning, there are practical ways to boost ridership at every station. The region would do well to take a close look at how to get the most return from our existing investments.


D.C.’s Metrorail Fares in Context

Posted: January 18th, 2008 | Author: | Filed under: BART, District of Columbia, San Francisco, Transportation, WMATA | 9 Comments »

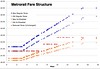
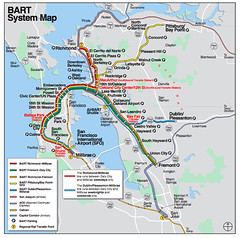
After completing my recent analysis of WMATA’s Metrorail fare increase, I decided to do some more research to better put the fares in a national context.

First, a took a look at how Metrorail compares with the nation’s other subway systems. As you can see, every subway except Philadelphia’s PATCO, San Francisco’s BART, and the D.C. Metro operate with a flat fare for all riders. BART and the D.C. Metro are the most expensive of all by far.

Metro Fares Compared

Next, I added the total system lengths as a rough measure of the distance and choices offered by each system. The big outlier here is the huge New York City Subway. Chicago’s CTA is roughly the same size as Metro, but generally cheaper at $2.00. (However it should be noted the CTA is in a financial crisis.) L.A.’s new subway is the cheapest of the group at $1.25.

Metro System Fares and Size

The D.C. Metro and San Francisco’s BART are often described as sister systems. They serve similar sized cities, were built at a similar time, and provide a similar type of service to their riders. They both also use a graduated fare system rather than a fixed fare. Like Metrorail, BART has recently adopted fare increases.

Metro System MapBART System Map

To complete the following analysis, for BART I used the 16th Street Mission station. For the Washington, D.C. fares I used the Shaw station. Both are residential neighborhoods located near the center of the systems, resulting in a good variety of destinations among the sample trips.

On the BART system, trips under 6 miles are fixed at $1.50, and longer trips vary according to length and where they run thanks to a variety of surcharges. (Airport trips are more expensive, for example.) Children, seniors, and the disabled receive a fixed 62.5% discount.

BART Fares

Here’s the result if you plot the regular fares from BART and Metrorail. For shorter trips, the two systems are roughly analogous, and for longer trips Metrorail is more expensive.

Metrorail and BART Regular Fares

However, as the most interesting result comes by graphing the per mile cost of each fare. It seems the new BART and Metrorail fares are nearly identical per mile, and like Metrorail the longest trips on BART are quite cheap per mile.

Metrorail and BART Per Mile Cost

Thanks to fellow Maryland community planning graduate student Matt Johnson, who helped me track down other system’s fares and calculated the BART station distances by hand.


Metro’s Fares Analyzed

Posted: January 3rd, 2008 | Author: | Filed under: District of Columbia, Transportation, WMATA | 14 Comments »

With the D.C. Metrorail’s fares set to increase on Sunday, it piqued my interest in precisely how the system determines charges and the nature of the changes. I decided to take a look at exactly what pattern the famously unpredictable fares took. While most news reports have reported suburban riders would experience the largest absolute increases, my analysis shows they continue to enjoying the lowest cost per mile of all riders, well below the cost of automobile use.

First as a note, while I support minimal user fees for public transit, I don’t have much patience for those who complain about any fare increase. The costs of running Metrorail — especially employee health insurance and electricity — have increased exponentially in recent years. However, funding from the area jurisdictions has not kept up. The agency was left with little choice than to raise fares to make up the difference. While the best solution might be a stable dedicated funding source, forcing austerity by blocking face increases would only compromise the system’s performance and reliability in the long term. Tight municipal regulation of fares was one reason the nation’s urban streetcar systems fell into disrepair in the 1930s and 40s, making them prone to purchase and closure by automobile companies. At the very least, WMATA should be able to adjust fares to keep pace with inflation (something the December decision allows).

To create these graphs, I analyzed the current and new fares for my home station, the Shaw-Howard University station on the Green Line. This set includes some trips that clock out at the new maximum fare — $4.50.

New Metro Fare Structure

The fares operate at a flat rate until the trip reaches about 3 miles in length, and then progressively increases until it reaches about 15 miles, where it remains at a maximum fare. The reduced (off-peak) fares are divided into three tiers, and will remain unchanged under the new plan.

While this graph makes it look as if urban riders are getting a subsidy and suburban riders must bear a high burden, a quick look at the fares per mile shows a quite different pattern.

Metrorail Cost Per Mile

Since most reliable estimates of the cost of operating an automobile range from $.50 per mile to $1.50 per mile, we can see most suburban commuters continue to enjoy costs substantially lower than driving if we exclude the more complex issue of speed. All this goes to make former WMATA Board Member T. Dana Kauffman’s claim the fare structure is a “raw deal” for suburban commuters all the more absurd.

Lastly, riders are familiar with the system’s estimated trip times, presented alongside the fares in stations and online. These times take into account train frequency and the number of transfers required. While I’m not sure exactly how they are created (and assume they mean peak times), I’ve found them to be roughly accurate. Using this data I have graphed the average trip speeds from the Shaw station.

Metro Average Speed

What do you think of the fare system and the increases?

> W. Post: Metro Passes Largest Fare Hikes in its History, Increases in Fares, Services Unequal
> WMATA: New station-to-station fares


Counting Metro’s Riders

Posted: December 7th, 2007 | Author: | Filed under: District of Columbia, Transportation, WMATA | 5 Comments »

We all know the D.C. Metro is busy. Thanks to a region-wide reach and decades of transit oriented development around many Metro stations, ridership of the Washington, D.C. Metrorail system is at record highs and growing. However, detailed data about the relative popularity of each station is harder to come by. How busy is each station, and how has popularity changed over time? Occasionally statistics are reported in the media, but data is not generally available.

However thanks to a friend I’ve obtained a spreadsheet showing the average weekday passenger boardings at all 86 stations in the Metrorail system, from its opening in 1977 to this year. The oldest data are counts completed by staff, but much of the recent data is collected by the fare gates and audited by outside consultants.

I’ve uploaded the data set to Swivel, a new service that hopes to be a social networking website for data. While it has many limitations, it does a good job at basic manipulations of this type of straightforward time series data. Let’s take a quick look. Here’s the total system ridership:

Average Daily Ridership

This data set contains graphs of the stations ranked by popularity each year. For example, here’s the 10 top stations in 1977, the year the system opened:

1977 by Station

Perhaps more interesting is this set, which shows the change in ridership at each station over time. In Chinatown, the opening of the Verizon Center and other development in the late 1990s has sparked a dramatic growth in ridership:

Gallery Place-Chinatown

Other stations have seen slower growth.

Dupont Circle

Many, like mine in Shaw, have experienced periods of ridership decline.

Shaw-Howard Univ

Of course, with Swivel you can also quickly compare various stations.

Green Line Ridership Growth

Take a look at the full sets online here: WMATA Ridership by Station, Ridership by Year

Blog Widget by LinkWithin